How To Create Custom Metrics
To display the metrics in the dashboard, you must both have the Chart of Accounts (accounting.xlsx) and dashboard-config (dashboard-primary.json5 and/or dashboard-customer.json5) files set up. These can be accessed from /private/dashboard folder of your account’s WebDAV server. If you do not have the accounting.xlsx file set up please see Chart of Accounts Excel File to get started.
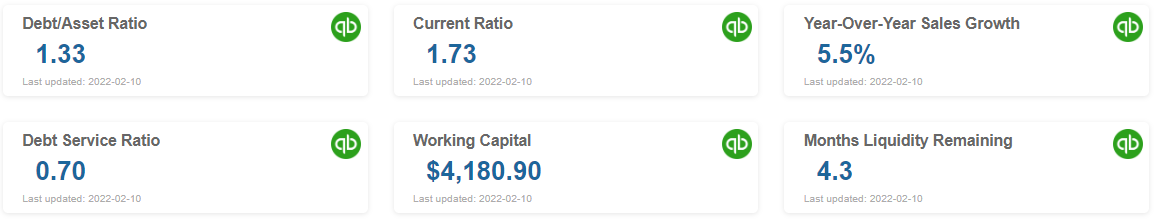
Sample Dashboard With Metrics
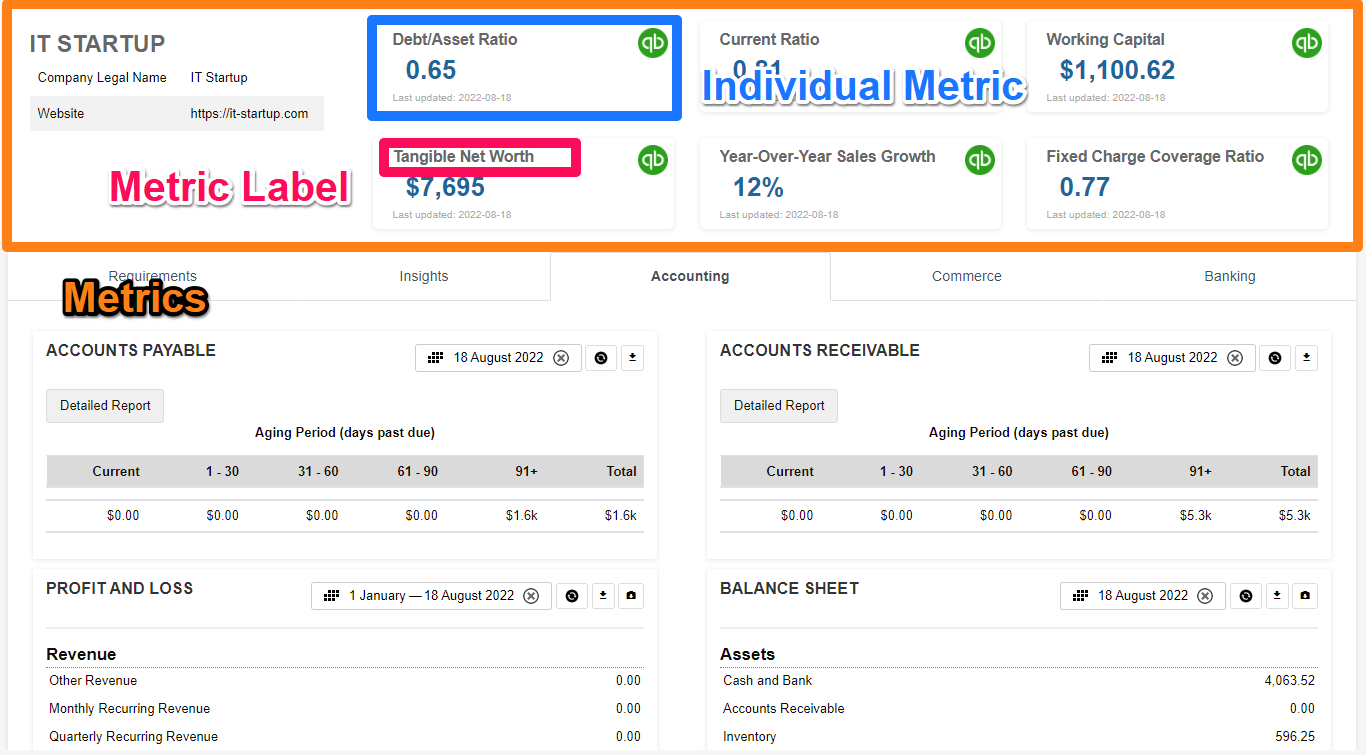
Image of Dashboard showing metrics outlined in orange, an example metric outlined blue, and the metric label outlined in pink.
Chart of Accounts Excel File
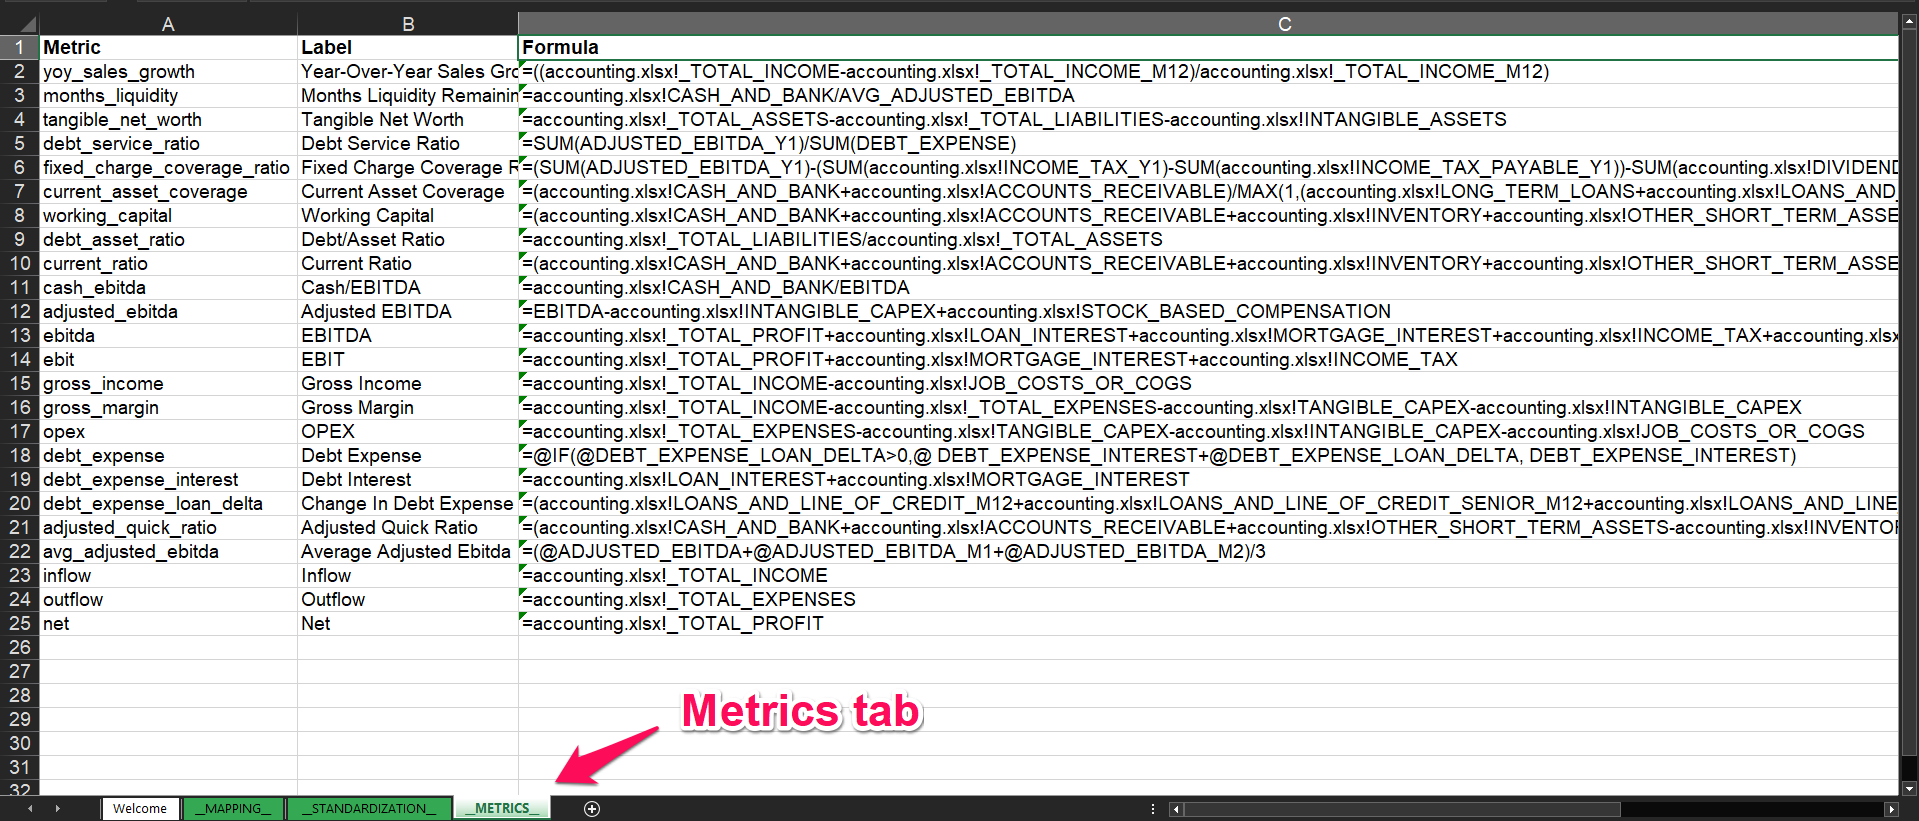
To begin, please locate the accounting.xlsx file within WebDav. Within this file, you will find the __METRICS__ sheet tab as shown in the image below. Here you will see the following columns: Metrics (column A), Label (column B), and Formula (column C). In the sample accounting.xlsx found under Chart of Accounts Excel File, you will see the same sample metrics and accompanying formulas as in the image below.
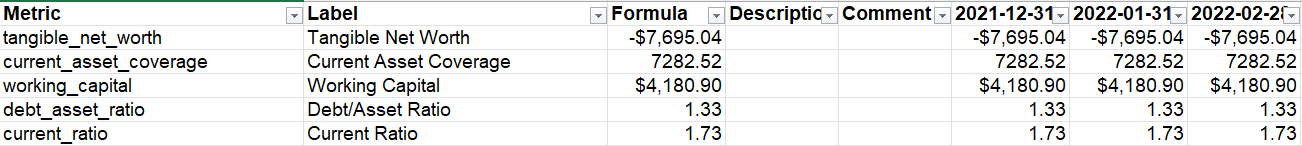
Below is an image of a populated Chart of Accounts sheet. Since the variables have values, the formulas return a value.
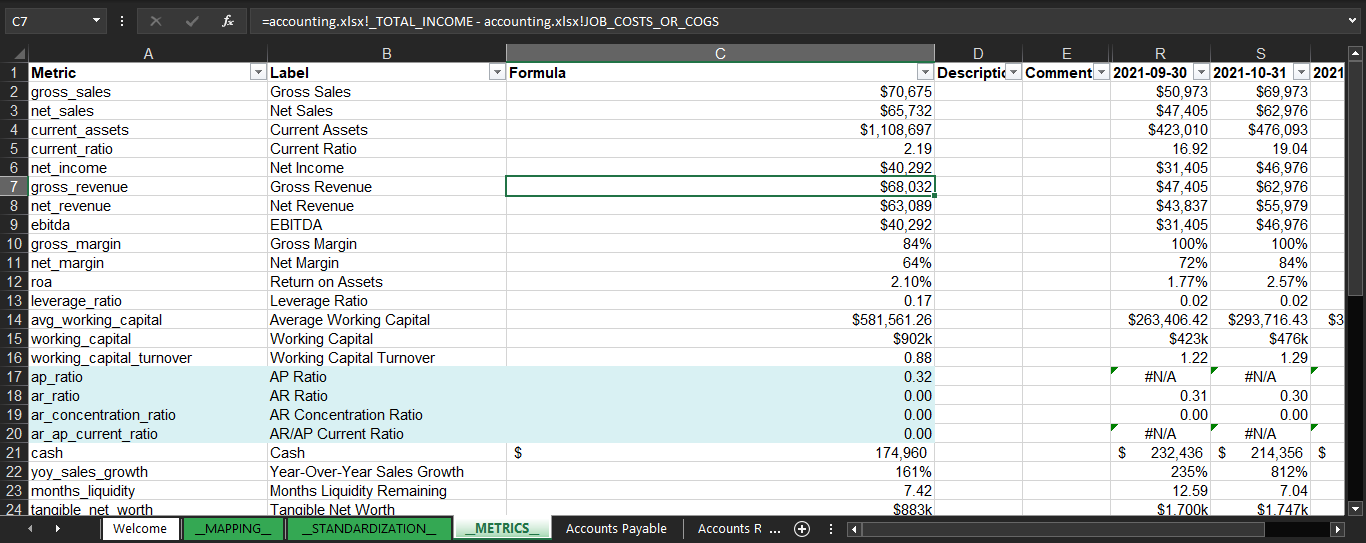
Image of Chart of Accounts spreadsheet populated with data. Formulas return values.
Columns In __METRICS__ Tab and Descriptions
Column | Description |
|---|---|
Metric | This is the metric’s id. In the API's response, this is the object's identifier that holds all the information for a specific metric. It is also what will be referenced in the metrics array within the dashboard configuration file. |
Label | This is the title or name that will display above the custom metric on your dashboard. Please see above for an example. |
Formula | The Excel formula calculated for a specific metric. You can use regular Excel functions here to estimate the metrics' values. You may follow the example ones found in the sample accounting.xlsx file or create your own. |
Which Variables To Use For Formula Creation
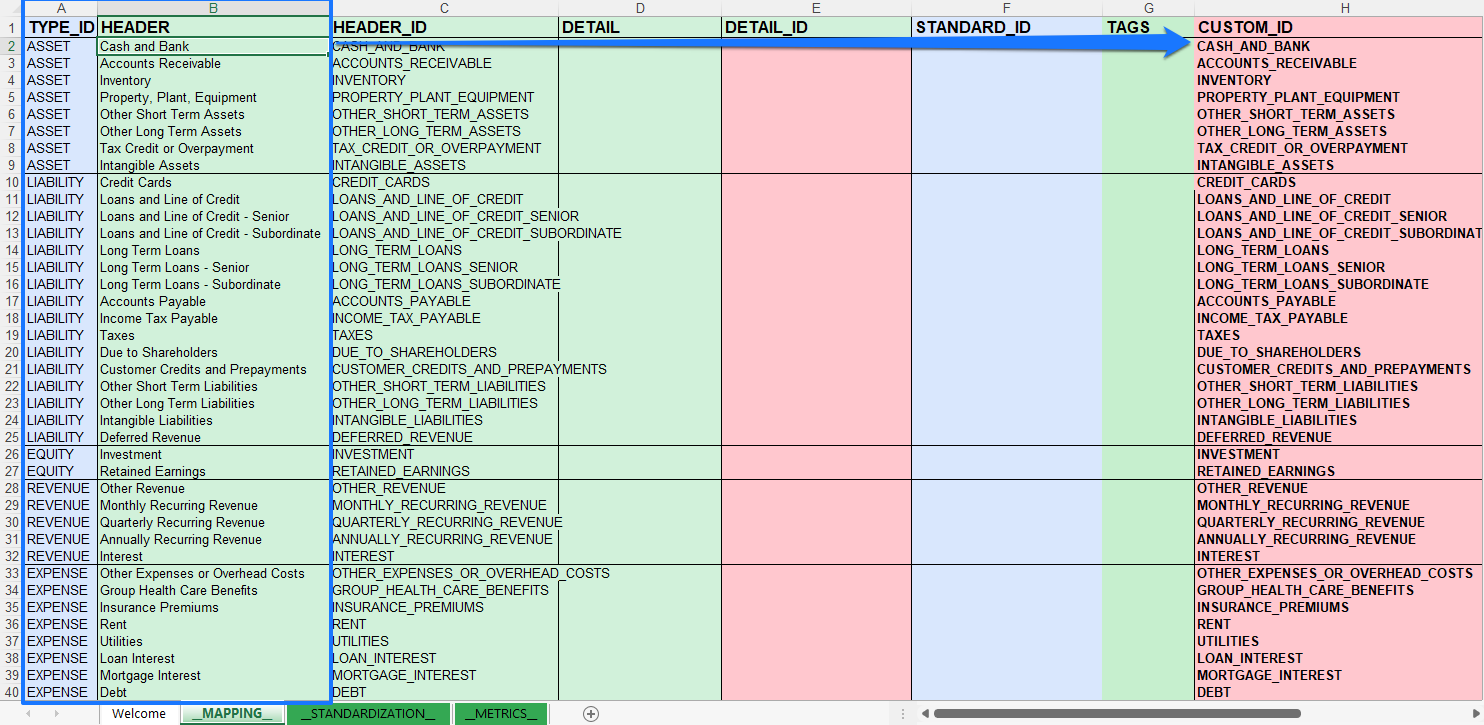
The variables come from the accounts listed in the Chart of Accounts (COA), which can be found in the CUSTOM_ID column from the __MAPPING__ sheet of the same Excel file. Those accounts have identifiers, which are the variables referenced in the formulas. In Excel terms, it works as if you would be referencing a cell as an argument in the formula, but you're using those custom ids instead.

If you are unsure which account a Custom ID refers to, you can check the TYPE_ID and HEADER columns. Additionally, if you want more information about how the COA works, visit Business Financial Template Excel File.
Now, an example of how to create a custom metric. Let's say I want to build a metric that returns a series of cash and bank accounts. Since we already know that the mentioned account's Custom ID is CASH_AND_BANK, we could do it like this:

Moreover, you can build metrics using other custom metrics as variables. In the example below, the metric Cash/EBITDA uses the ebitda custom metric as a function argument. Please make sure the custom metric is in capital letters when adding it to a custom metric formula and to save your changes before requesting the metrics API endpoint.

Using Data from Previous Periods in Formulas
You can build metric formulas using information from previous periods. All you have to do is concatenate the unit (_M for “month” and _Y for “year”) and the period of time (an integer with 1 as the minimum value allowed) to the account’s Custom ID.
For example, to create an n-months moving average formula for cash and bank, the syntax would be:
CASH_AND_BANK_M1 + CASH_AND_BANK_M2 + … + CASH_AND_BANK_Mn
The screenshot below contains an example of a 3-months moving average metric for CASH_AND_BANK:

List of Global Variables
Here you can find a list of some variables that are not explicitly listed in the __MAPPING__ sheet but can still use them to create metric formulas.
Custom ID | Name | Definition |
|---|---|---|
_TOTAL_ASSETS | Total Assets | Sum of the values from all accounts of type “asset” |
_TOTAL_LIABILITIES | Total Liabilities | Sum of the values from all accounts of type “liabilities” |
_TOTAL_EQUITY | Total Equity | Sum of the values from all accounts of type “equity” |
_TOTAL_INCOME | Total Income | Sum of the values from all accounts of type “income” |
_TOTAL_EXPENSES | Total Expenses | Sum of the values from all accounts of type “expenses” |
_TOTAL_PROFIT | Total Profit | Arithmetic difference between “Total Income” and “Total Expenses”, respectively |
List of Default Metrics
There is no exhaustive list of metrics since they can be custom defined. If you’re looking for a metric you don’t see here please contact support as we have additional metrics libraries available.
metric id | Name | Formula |
|---|---|---|
yoy_sales_growth | Year-Over-Year Sales Growth | =((_TOTAL_INCOME-_TOTAL_INCOME_M12)/_TOTAL_INCOME_M12) |
months_liquidity | Months Liquidity Remaining | =CASH_AND_BANK/AVG_ADJUSTED_EBITDA |
tangible_net_worth | Tangible Net Worth | =_TOTAL_ASSETS-_TOTAL_LIABILITIES-INTANGIBLE_ASSETS |
debt_service_ratio | Debt Service Ratio | =SUM(ADJUSTED_EBITDA_Y1)/SUM(DEBT_EXPENSE) |
fixed_charge_coverage_ratio | Fixed Charge Coverage Ratio | =(SUM(ADJUSTED_EBITDA_Y1)-(SUM(INCOME_TAX_Y1)-SUM(INCOME_TAX_PAYABLE_Y1))-SUM(DIVIDENDS_Y1)-SUM(TANGIBLE_CAPEX_Y1))/SUM(DEBT_EXPENSE) |
current_asset_coverage | Current Asset Coverage | =(CASH_AND_BANK+ACCOUNTS_RECEIVABLE)/MAX(1,(LONG_TERM_LOANS+LOANS_AND_LINE_OF_CREDIT)) |
working_capital | Working Capital | =(CASH_AND_BANK+ACCOUNTS_RECEIVABLE+INVENTORY+OTHER_SHORT_TERM_ASSETS)-(ACCOUNTS_PAYABLE+CREDIT_CARDS+OTHER_SHORT_TERM_LIABILITIES) |
debt_asset_ratio | Debt/Asset Ratio | =_TOTAL_LIABILITIES/_TOTAL_ASSETS |
current_ratio | Current Ratio | =(CASH_AND_BANK+ACCOUNTS_RECEIVABLE+INVENTORY+OTHER_SHORT_TERM_ASSETS)/(ACCOUNTS_PAYABLE+CREDIT_CARDS+OTHER_SHORT_TERM_LIABILITIES) |
cash_ebitda | Cash/EBITDA | =CASH_AND_BANK/EBITDA |
adjusted_ebitda | Adjusted EBITDA | =EBITDA-INTANGIBLE_CAPEX+STOCK_BASED_COMPENSATION |
ebitda | EBITDA | =_TOTAL_PROFIT+LOAN_INTEREST+MORTGAGE_INTEREST+INCOME_TAX+DEPRECIATION+AMORTIZATION |
ebit | EBIT | =_TOTAL_PROFIT+MORTGAGE_INTEREST+INCOME_TAX |
gross_income | Gross Income | =_TOTAL_INCOME-JOB_COSTS_OR_COGS |
gross_margin | Gross Margin | =_TOTAL_INCOME-_TOTAL_EXPENSES-TANGIBLE_CAPEX-INTANGIBLE_CAPEX |
opex | OPEX | =_TOTAL_EXPENSES-TANGIBLE_CAPEX-INTANGIBLE_CAPEX-JOB_COSTS_OR_COGS |
debt_expense | Debt Expense | =@IF(@DEBT_EXPENSE_LOAN_DELTA>0,@ DEBT_EXPENSE_INTEREST+@DEBT_EXPENSE_LOAN_DELTA, DEBT_EXPENSE_INTEREST) |
debt_expense_interest | Debt Interest | =LOAN_INTEREST+MORTGAGE_INTEREST |
debt_expense_loan_delta | Change In Debt Expense | =(LOANS_AND_LINE_OF_CREDIT_M12+LOANS_AND_LINE_OF_CREDIT_SENIOR_M12+LOANS_AND_LINE_OF_CREDIT_SUBORDINATE_M12+LONG_TERM_LOANS_M12+LONG_TERM_LOANS_SENIOR_M12+LONG_TERM_LOANS_SUBORDINATE_M12) LOANS_AND_LINE_OF_CREDIT+LOANS_AND_LINE_OF_CREDIT_SENIOR |
adjusted_quick_ratio | Adjusted Quick Ratio | =(CASH_AND_BANK+ACCOUNTS_RECEIVABLE+OTHER_SHORT_TERM_ASSETS-INVENTORY)/ACCOUNTS_PAYABLE+CREDIT_CARDS+OTHER_SHORT_TERM_LIABILITIES |
avg_adjusted_ebitda | Average Adjusted Ebitda | =(@ADJUSTED_EBITDA+@ADJUSTED_EBITDA_M1+@ADJUSTED_EBITDA_M2)/3 |
inflow | Inflow | =_TOTAL_INCOME |
outflow | Outflow | =_TOTAL_EXPENSES |
net | Net | =_TOTAL_PROFIT |
How to Debug and Visualize the Calculations on Excel
It's possible to download the calculations for the metrics in an Excel file through the private API for the metrics. To do that, you must make a request to the metrics private API with a download parameter set to true. It should look similar to this:
https://{subdomain}.{domain}/apps/dashboard/data.php?account={account_key}&item=metrics&download=trueWhere account_key is the account key of the customer's account you're calculating the metrics for. This will start a download. In this file, there is a sheet named __METRICS__, where the calculations will be and look similar to this:
How to Add Metrics to Dashboards
To add your custom metrics to dashboards:
Open the dashboard configuration file on your account's WebDAV /private/dashboard folder (dashboard-primary.json5 for the main portal or dashboard-customer.json5 for the customer's portal).
The file should have a key named metrics, which holds an array of strings (you can include it in the file if it's not there). Add the metrics' ids you'd like to be displayed in the dashboard as metric cards. Please list the elements/metrics in the order you would like them to display on the dashboard (left to right). It should look similar to this:
CODE{ ... metrics: [ 'debt_asset_ratio', 'current_ratio', 'yoy_sales_growth', 'debt_service_ratio', 'working_capital', 'months_liquidity', ], ... }You may also look at an example completed configuration file.
After making the changes, save the file. When you visit the dashboard, you should see the metric cards displayed at the top of the page:
Completed Dashboard Configuration File
To see a sample of a completed dashboard configuration file, please see here.