Viewing Company Insights
Financial Institutions can see a general overview of any Business Customer that has set up Data Sharing.
Instructions
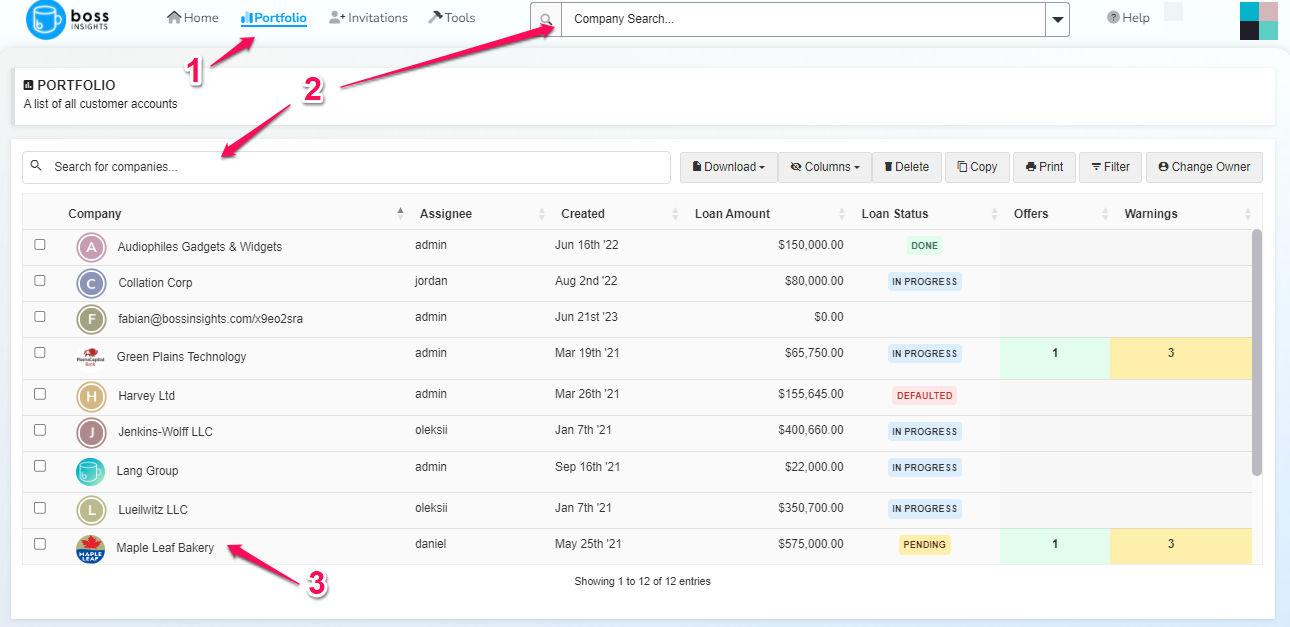
Log in to your Boss Insights domain and then click the “Portfolio” button from the top navigation bar.
Next, you can use the either the search bar in the top navigation, or the search bar within the page to find the company you want to look up. The search bar within the page will filter out companies as you type in the name. You may also choose the company from the businesses list that appears within the page.
Please click the the business that you are interested in. In the example below, we have clicked “Maple Leaf Bakery”
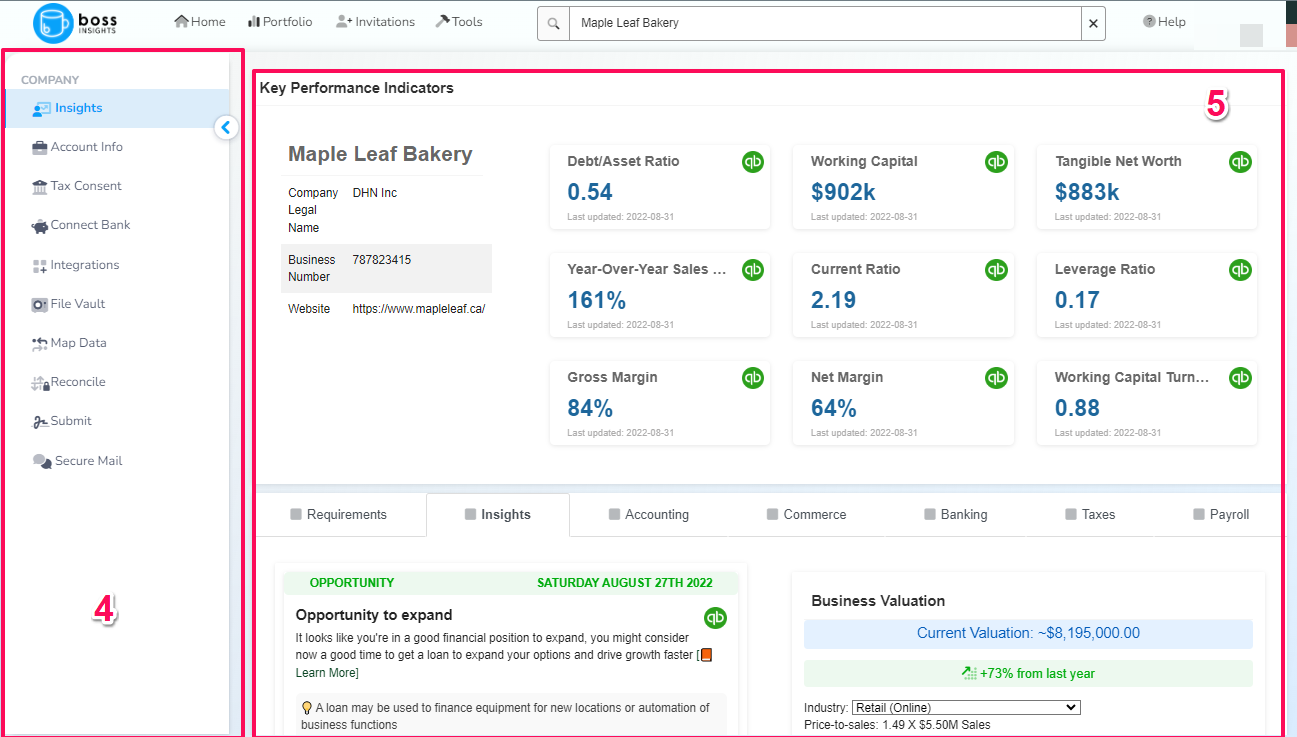
Once you have selected the business, new menu items will appear in the left side bar, this is their workflow.
The Company Insights Dashboard is a modular dashboard with configurable panels. On this page you can find panels with financial statements, charts and graphs, profile information, and more.
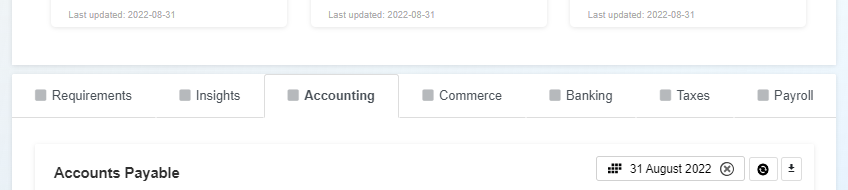
The “Balance Sheet” and “Profit and Loss” widgets can can typically be found under the “Accounting” Tab. These widgets may have been configured to a different tab. For more details on tabs, please scroll down to the “Access To Commerce, Banking, Tax And Payroll Information” section.
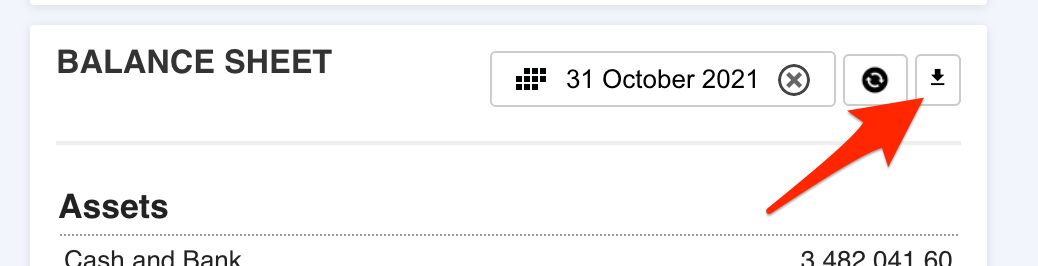
Both these widgets have date pickers in their top right corner. To generate a financial statement for a specific date or date range, click on the date picker. This will open a small pop-up window where you can select a date.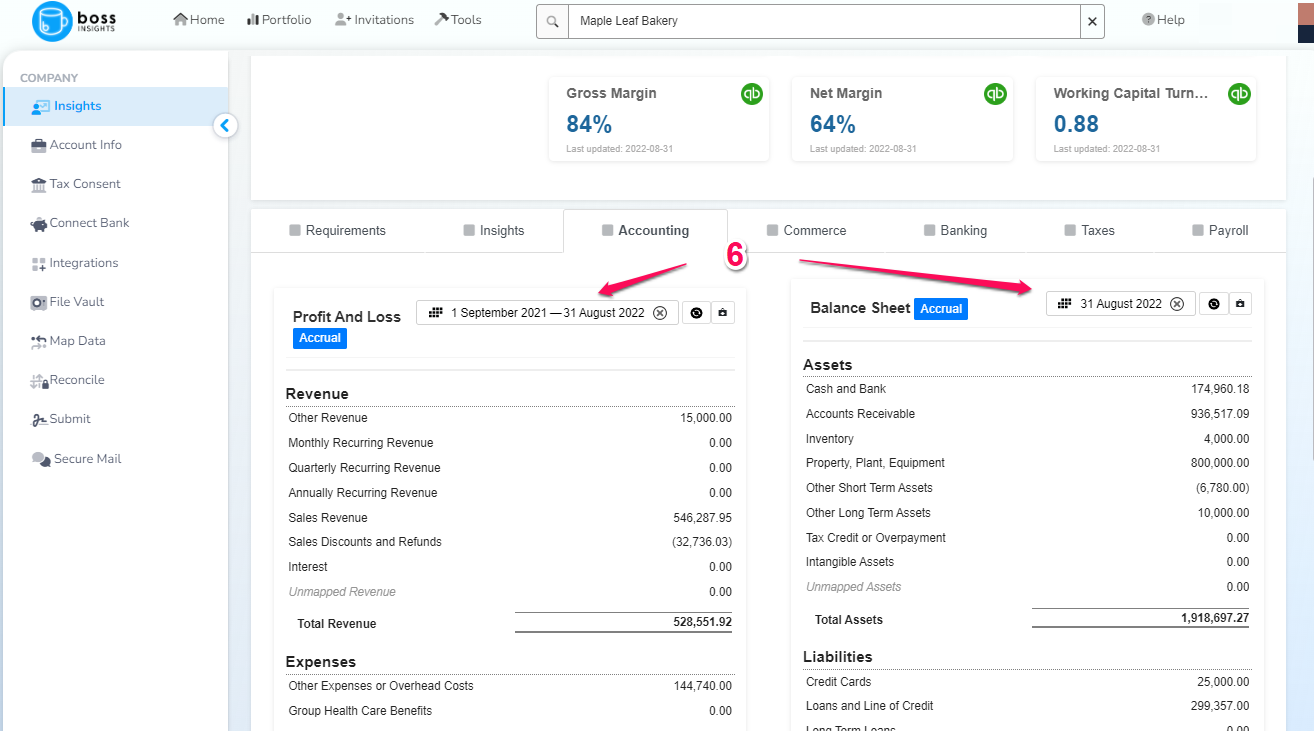
Select a date by clicking on the calendar, or by typing into the box at the bottom, then click the yellow “OK” button. A financial statement will be generated instantly using any financial data that the borrower has shared via cloud connection or file upload. If the borrower has not shared enough information to generate the requested financial statement, you will see a message saying “insufficient data for selected date”.
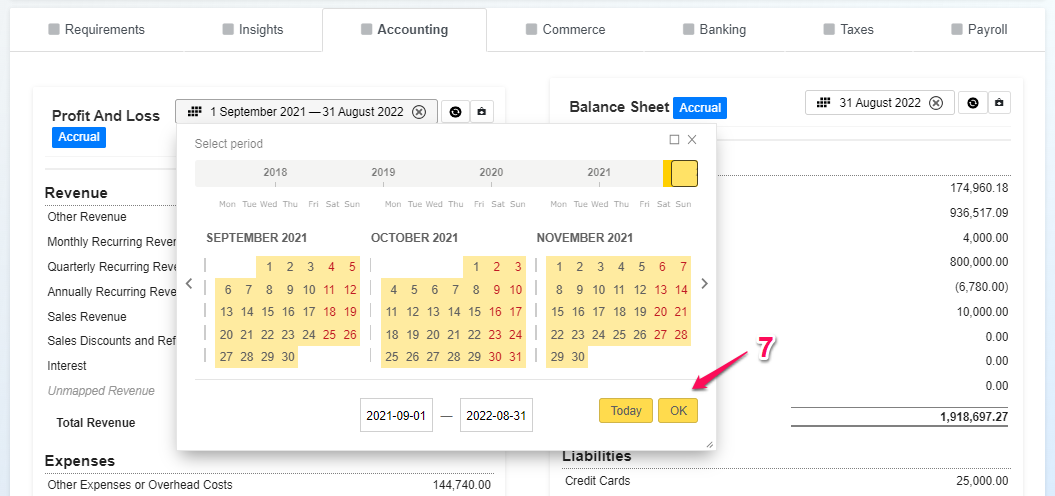
Since historical financial information is permanent, we use cached financial statements when possible instead of generating new ones every time. If for some reason the borrower’s source financial data has been changed, you can use the refresh button to the right of the date picker. This will ignore any cached financial statements and will fetch the latest data from the borrower’s cloud connections and uploaded files.
Access To Financial Statements
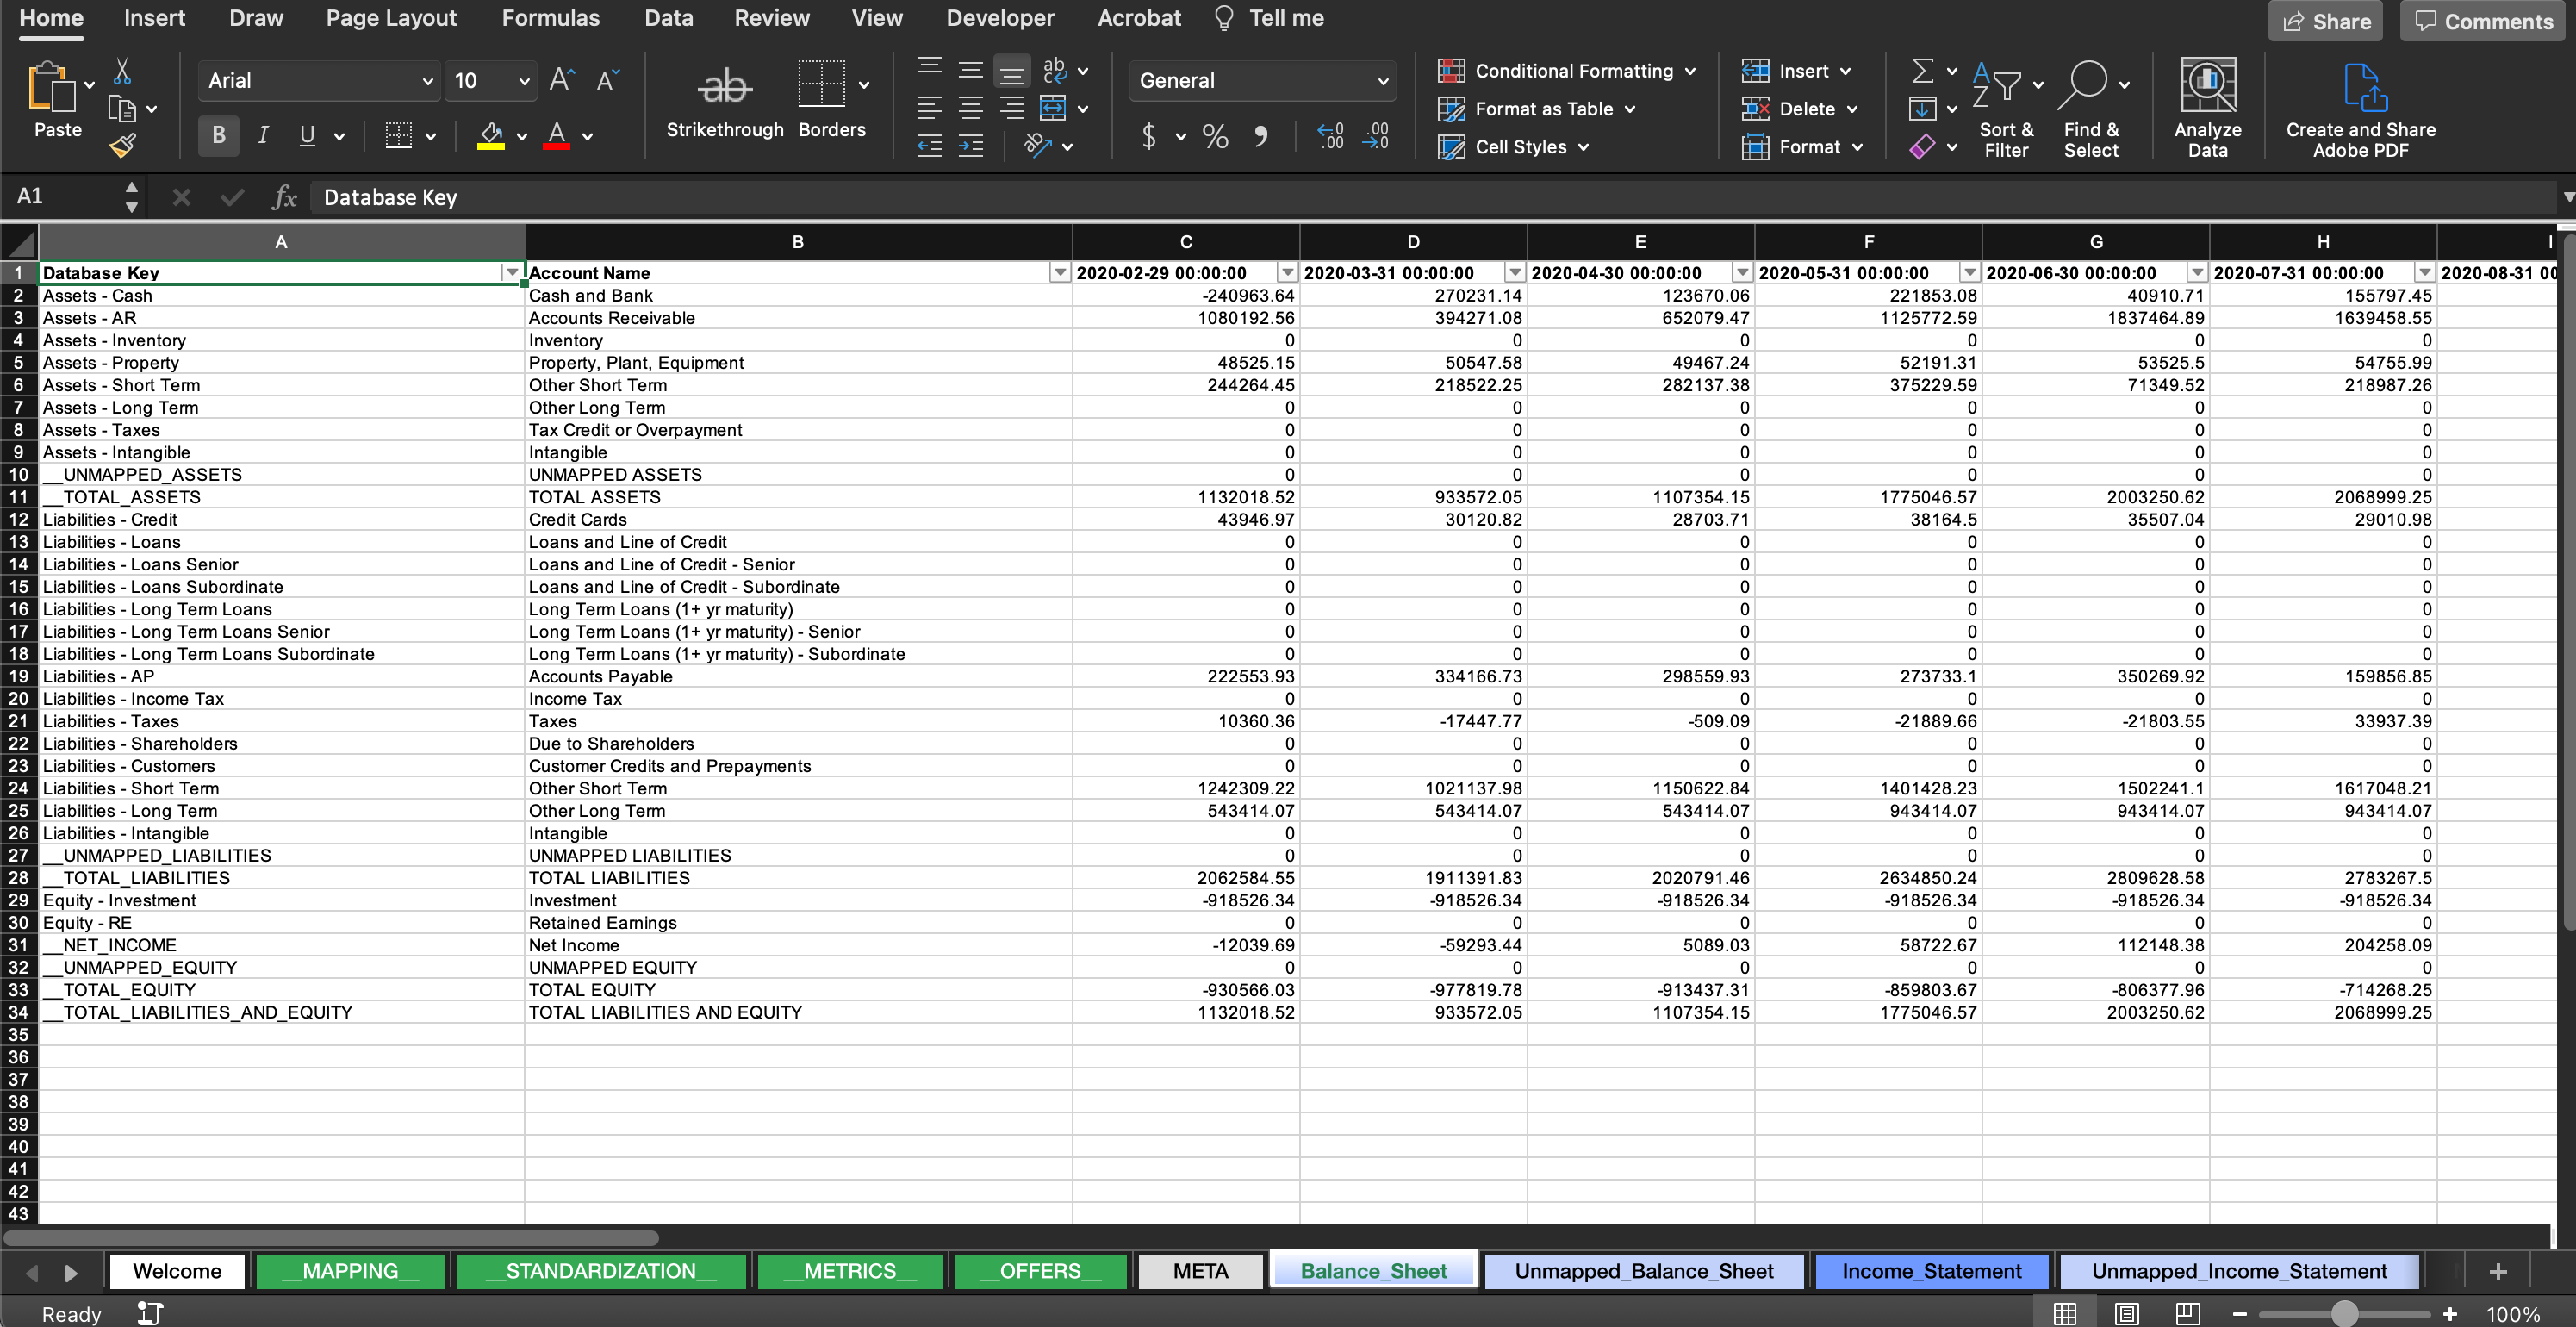
The “Balance Sheet” and “Profit and Loss” panels also provide a download button that allows you to access a Microsoft Excel workbook containing the company financial statements in both categorized (aka “mapped”) and uncategorized views.
The workbook allows you to see how a companies finances have changed over time:
Access To Commerce, Banking, Tax And Payroll Information
Other information types may also be shown on the insights panel depending on what data package options you are subscribed to. When viewing insights for a specific company you will see a set of tabs which breakout the categories of data:
Within these tabs different widgets will be shown, sometimes as charts and tables and other times as options to download data files for offline analysis. For a list of widgets, please see our Widget Catalog.
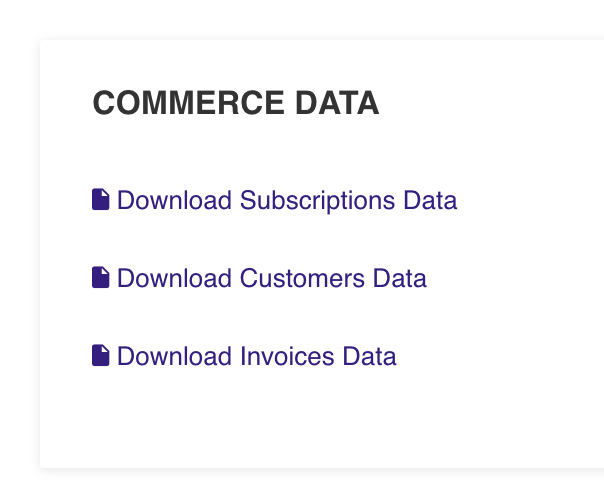
Some download options for commerce data
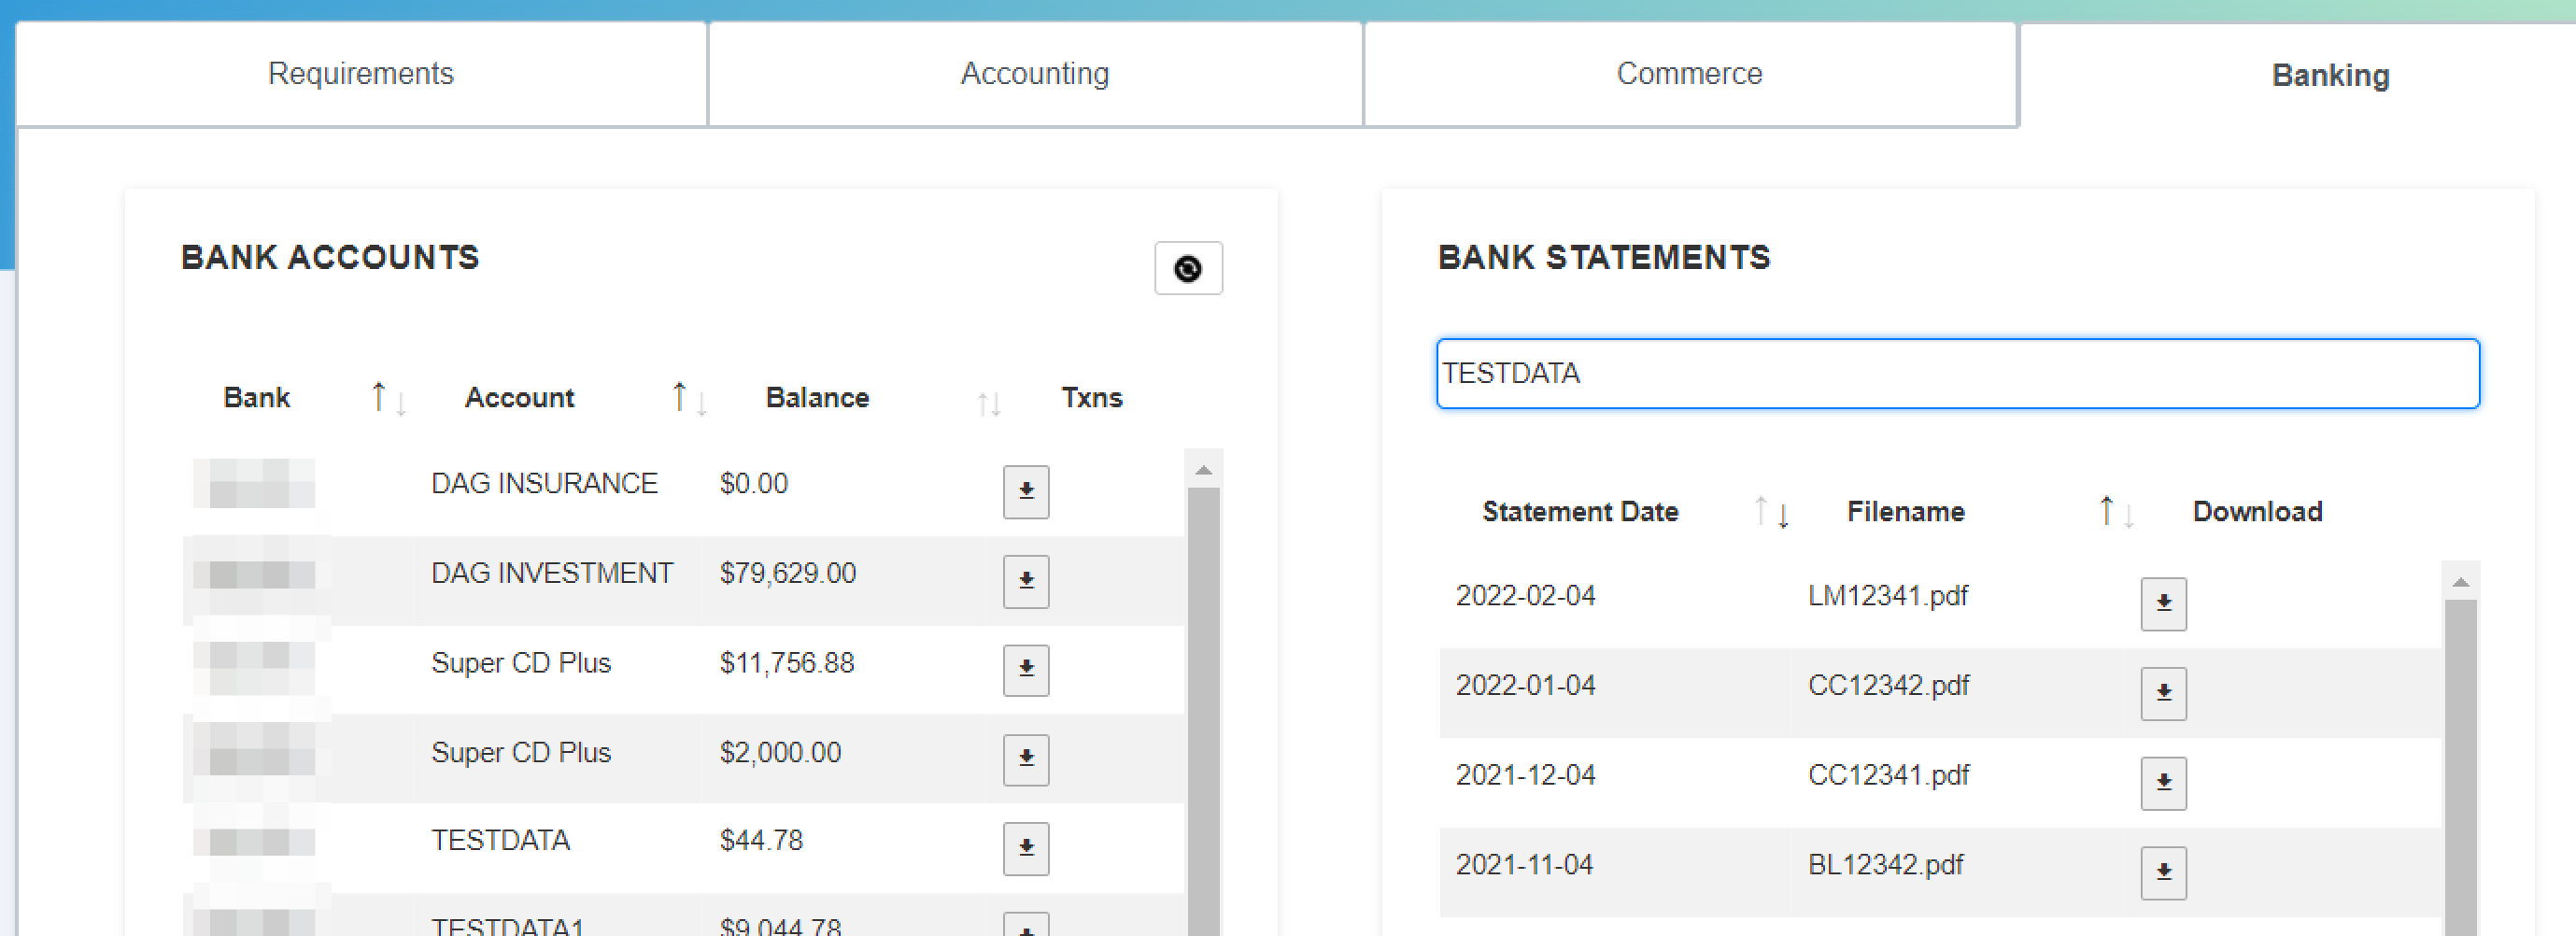
Bank account balances, transaction lists and statements for download