Insights
Insights are necessary for any business for informed decision-making and risk mitigation. They provide deeper understanding of various aspects of a business including its financial health.
As a Financial Institution (FI), you can use Boss Insights to gain a 360 degree view of your portfolio’s financial health with insights and ratios. You can get access to the broadest coverage of accounting, banking, commerce, payroll, tax data and more.
Getting Started
To get started, you will need to set up a Chart of Accounts. Continue reading to learn more.
Chart of Accounts
Business Insights are calculated from a Chart of Accounts that pulls data from integrations and standardizes the mappings. When data is presented in a similar fashion, it is easier to visualize and understand. The chart can be translated into metrics and widgets that can be displayed on the Insights Dashboard or embedded within your own product.
Insights Dashboard
The Insights Dashboard is available within The Portal. It’s display of key performance indicators, widgets and metrics can help you visualize and obtain information about your business portfolio.
The Insights tab within the Dashboard example below shows a business valuation. You are able to see data based on the industry as well. To the right of the business valuation, you will see coloured headings categorized as either RISK, OPPORTUNITY, IMPORTANT, INFORMATIVE .
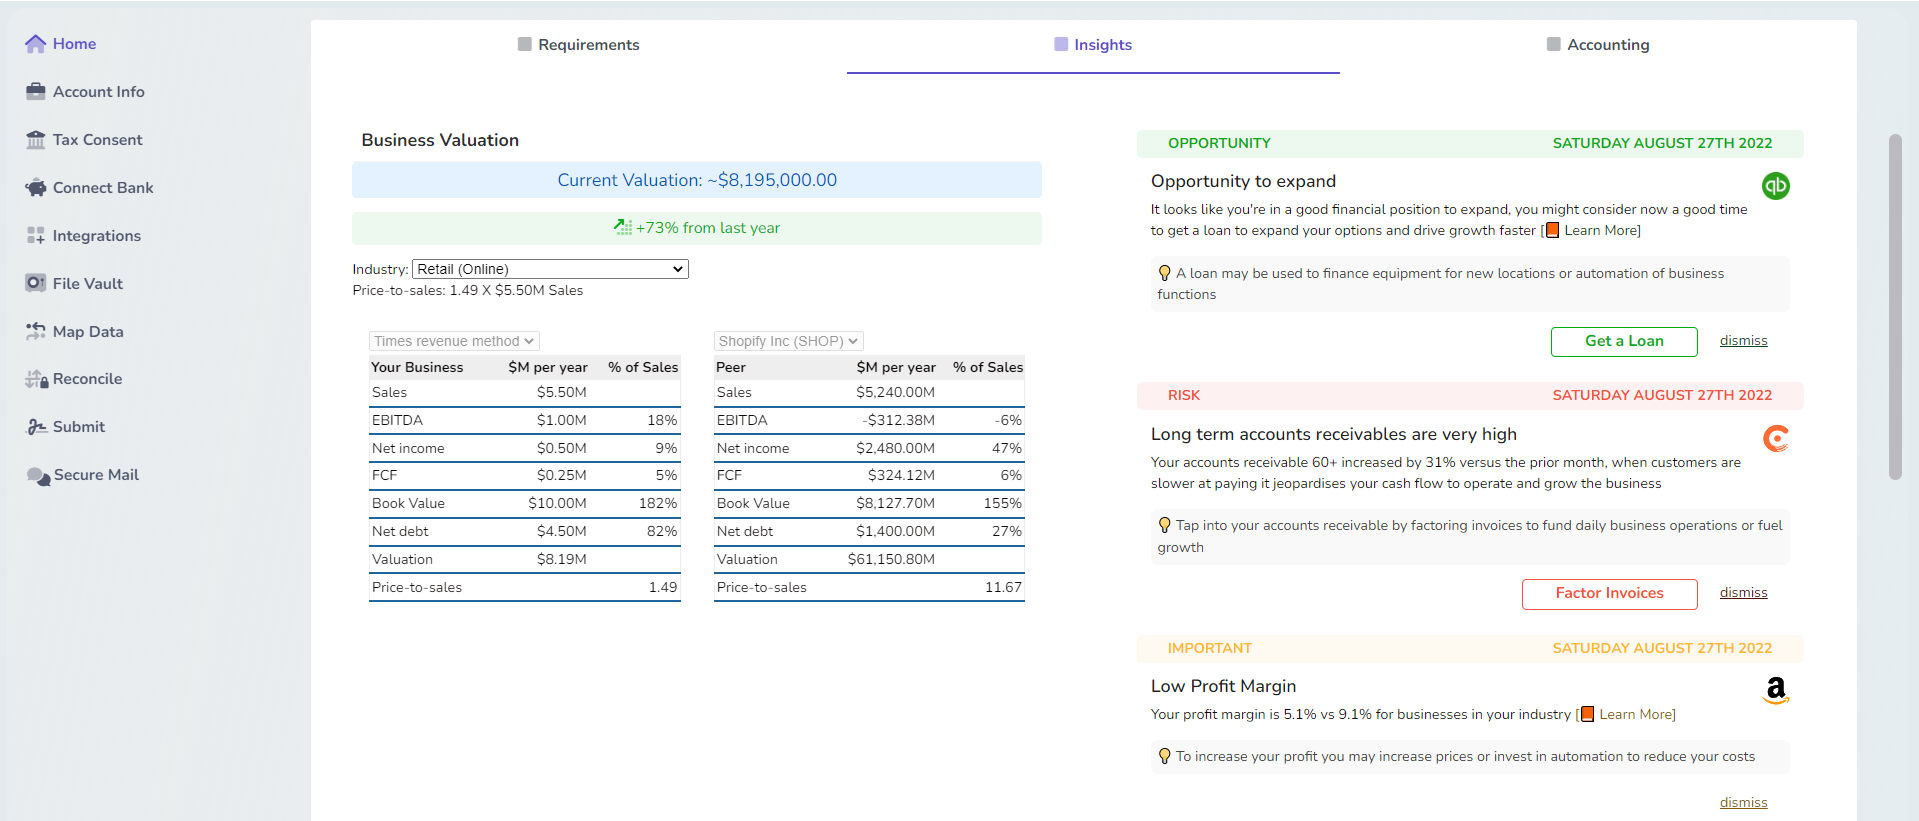
Insights tab on the Dashboard.
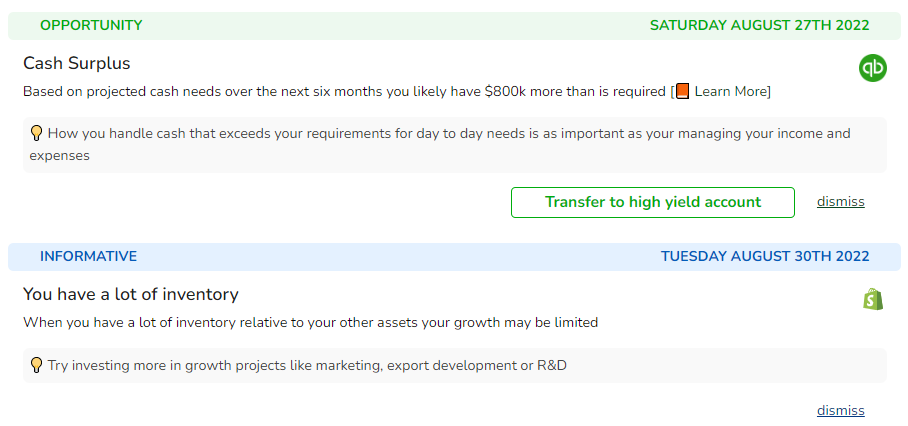
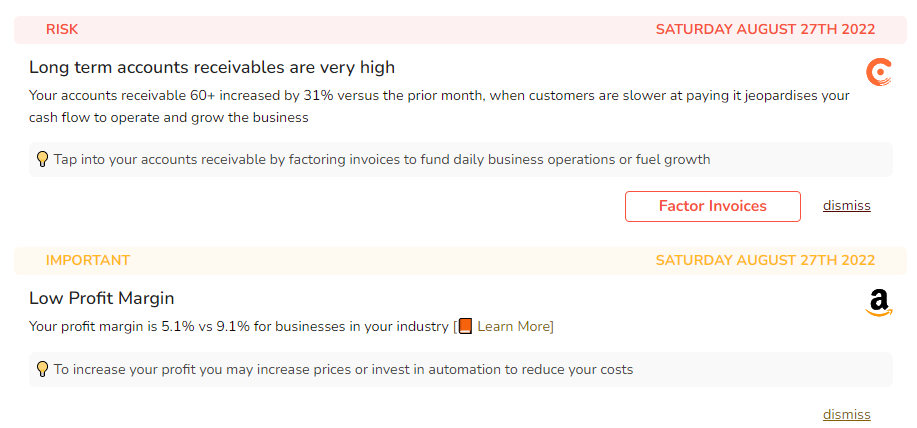
OPPORTUNITY will show opportunities for growth such as a cash surplus and advice on pursuing that opportunity. INFORMATIVE insights will display insights that can be turned into opportunities. RISK headings will contain information on potential risks such as long term accounts receivables being very high. IMPORTANT will display insights that are not yet risks but have the potential to be. These are areas of concerns. Each insight will have advice on what to do including growth or risk mitigation.
From the Dashboard, you are also able to download financial statements such as a balance sheets and profit and loss report. You can also access other information such commerce, banking, tax and payroll from their respective tabs. Within these tabs specific components will be shows, such as charts, tables, or files to download. You may check out our product guide for more information viewing company insights within The Portal.